
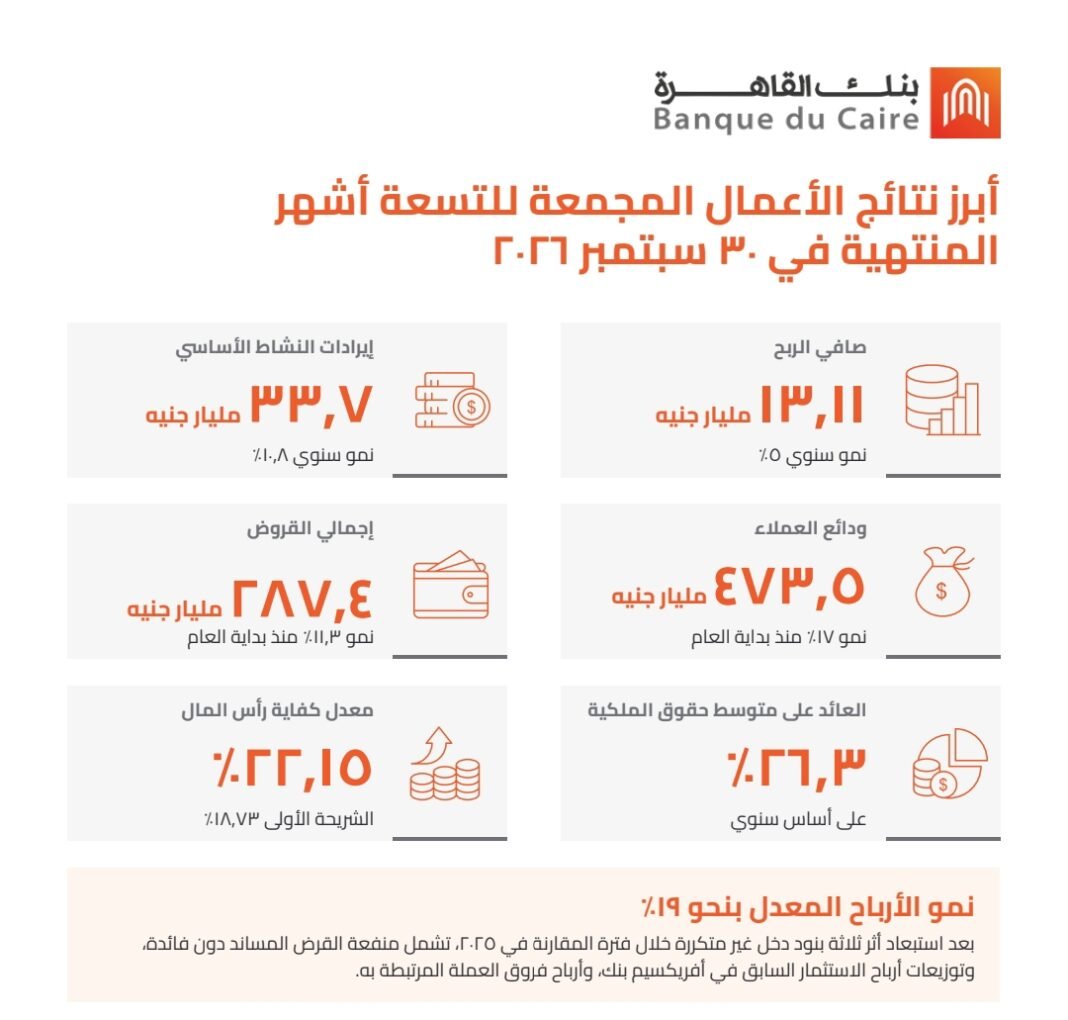

Banque du Caire delivered solid financial performance during the first nine months of 2026, reflecting robust core profitability, healthy business growth, an improving funding mix and a strong capital position. Net profit increased by 19% after excluding the impact of three non-recurring income items recognised during the comparative period.
Consolidated Financial Statements – First Nine Months of 2026
The Bank achieved consolidated net profit of EGP 13.1 billion for the first nine months of 2026, compared with EGP 11.06 billion for the same period of 2025. Excluding the impact of three non-recurring income items recognised during the comparative period, consolidated net profit growth reached approximately 19%. These items comprised income generated from the interest-free subordinated loan, which was repaid in December 2025; dividend income from the Bank’s investment in the African Export-Import Bank (Afreximbank), which was subsequently sold; and foreign exchange gains associated with this foreign currency-denominated investment. Profit before tax reached EGP 19.2 billion, compared with EGP 15.9 billion for the same period of the previous year, an increase of 20.9%.
Consolidated total operating income for the first nine months of 2026 increased by 16.2% to EGP 34.6 billion, compared with EGP 29.74 billion in the same period of the previous year, driven by 14.8% growth in net interest income and 13.0% growth in net fee and commission income. Core revenues (net interest income plus net fee and commission income) rose by 14.5% to EGP 33.7 billion. Administrative expenses increased by 18.0% to EGP 12.4 billion, reflecting continued investment in core banking modernisation and digital transformation, with the cost-to-income ratio at 36.0%.
Consolidated total assets increased by 11.2% to EGP 600.9 billion at 30 September 2026, compared with EGP 540.4 billion at 31 December 2025, and by 7.1% from 30 June 2026. Customer deposits grew by 17.0%, or around EGP 69 billion, to EGP 473.5 billion (up 6.7% quarter on quarter), with retail customers accounting for 74% of the deposit base, and the CASA ratio improved by 130 basis points to 52.7%. Gross loans to customers and banks rose by 11.3% to EGP 287.4 billion (up 2.5% quarter on quarter), led by corporate lending, up 12.0%, and retail lending, up 10.2%, with a gross loan-to-deposit ratio of 60.7%. Total equity, including non-controlling interests, rose by 12.3% to EGP 70.3 billion.
Asset quality remained sound, with a non-performing loan ratio of 3.70% and coverage of 173.1% at 30 September 2026, with an adjusted NPL (Excluding the loans granted before 2020) ratio of 2.49% on a standalone basis, while expected credit loss charges declined by 44.0% to EGP 2.1 billion, compared with EGP 3.8 billion in the same period of the previous year, with cost of risk at 1.03% (9M 2025: 2.09%). The Bank maintained a strong capital base, with a capital adequacy ratio of 22.15% and a Tier 1 ratio of 18.73%, and a strong liquidity position, with a liquidity coverage ratio of 759.0% and a net stable funding ratio of 177.3% on a standalone basis. Annualised return on average equity was 26.3%, annualised return on average assets was 3.1%, and net interest margin was 7.2%.
In the third quarter of 2026, consolidated operating income rose 2.2% quarter on quarter to EGP 11.8 billion, with core revenues up 1.7% to EGP 11.5 billion. Net profit declined 13.1% to EGP 4.2 billion from EGP 4.8 billion in the second quarter, mainly reflecting higher expected credit loss charges of EGP 1.1 billion (Q2 2026: EGP 489 million) and other expenses of EGP 231 million, compared with other income of EGP 115 million in the second quarter.
Financial Statements
Consolidated Income Statement
EGP million Q3 2026 Q2 2026 QoQ 9M 2026 9M 2025 YoY
Net interest income 9,661 9,451 2.2% 28,453 25,764 10.4%
Net fee and commission income 1,836 1,850 -0.8% 5,263 4,658 13.0%
Core revenues¹ 11,497 11,301 1.7% 33,716 30,422 10.8%
Other operating income 284 221 28.5% 841 854 -1.5%
Total operating income² 11,781 11,522 2.2% 34,557 31,276 10.5%
Expected credit loss charge (1,087) (489) 122.3% (2,108) (3,766) -44.0%
Administrative expenses (4,254) (4,141) 2.7% (12,436) (10,535) 18.0%
Other income / (expenses) (231) 115 NM (824) 781 NM
Profit before tax 6,209 7,006 -11.4% 19,189 17,756 8.1%
Income tax (2,040) (2,209) -7.7% (6,078) (5,233) 16.1%
Net profit after tax⁴ 4,169 4,797 -13.1% 13,111 12,523 4.7%
Standalone Income Statement
EGP million Q3 2026 Q2 2026 QoQ 9M 2026 9M 2025 YoY
Net interest income 9,425 9,228 2.1% 27,743 25,129 10.4%
Net fee and commission income 1,820 1,801 1.1% 5,157 4,555 13.2%
Core revenues¹ 11,245 11,029 2.0% 32,900 29,684 10.8%
Other operating income 227 25 808.0% 682 942 -27.6%
Total operating income² 11,472 11,054 3.8% 33,582 30,626 9.7%
Expected credit loss charge (1,123) (474) 136.9% (2,126) (3,768) -43.6%
Administrative expenses (3,996) (3,918) 2.0% (11,761) (9,947) 18.2%
Other income / (expenses) (259) 112 NM (871) 785 NM
Profit before tax 6,094 6,774 -10.0% 18,824 17,696 6.4%
Income tax (2,012) (2,165) -7.1% (6,155) (5,124) 20.1%
Net profit after tax 4,082 4,609 -11.4% 12,669 12,572 0.8%
Balance Sheet
CONSOLIDATED STANDALONE
EGP million Sep-26 Jun-26 QoQ Dec-25 YtD Sep-26 Jun-26 QoQ Dec-25 YtD
Cash and balances with the CBE 44,627 41,255 8.2% 35,152 27.0% 43,836 40,511 8.2% 34,492 27.1%
Due from banks 45,826 48,344 -5.2% 93,413 -50.9% 45,063 47,414 -5.0% 92,858 -51.5%
Net loans to customers 240,331 235,013 2.3% 222,027 8.2% 240,710 235,170 2.4% 221,851 8.5%
Net loans to banks 28,534 27,153 5.1% 18,693 52.6% 28,534 27,153 5.1% 18,693 52.6%
Treasury investments and others 210,592 178,150 18.2% 144,510 45.7% 207,949 175,602 18.4% 142,245 46.2%
Subsidiaries, associates & properties 1,310 1,235 6.0% 1,663 -21.2% 4,165 4,165 0.0% 3,868 7.7%
Other assets 29,712 30,070 -1.2% 24,925 19.2% 21,160 22,483 -5.9% 18,555 14.0%
Total assets 600,931 561,220 7.1% 540,382 11.2% 591,417 552,497 7.0% 532,562 11.1%
Due to banks 7,461 2,972 151.1% 2,508 197.5% 7,811 3,391 130.4% 2,912 168.2%
Customer deposits 473,484 443,878 6.7% 404,540 17.0% 470,243 440,419 6.8% 401,362 17.2%
Other loans 22,643 21,663 4.5% 46,275 -51.1% 18,758 18,300 2.5% 43,453 -56.8%
Other liabilities 27,050 25,881 4.5% 24,448 10.6% 25,991 25,154 3.3% 23,789 9.3%
Total liabilities 530,638 494,393 7.3% 477,771 11.1% 522,803 487,263 7.3% 471,516 10.9%
Issued and paid-up capital 30,500 30,500 0.0% 20,500 48.8% 30,500 30,500 0.0% 20,500 48.8%
Paid under capital increase — — — 10,000 NM — — — 10,000 NM
Reserves 6,839 7,485 -8.6% 9,181 -25.5% 5,118 5,824 -12.1% 7,210 -29.0%
Retained earnings 32,931 28,820 14.3% 22,915 43.7% 32,996 28,909 14.1% 23,336 41.4%
Net shareholders’ equity 70,271 66,805 5.2% 62,596 12.3% 68,614 65,234 5.2% 61,047 12.4%
Non-controlling interests 22 21 5.3% 15 46.2% — — — — —
Total equity 70,293 66,826 5.2% 62,611 12.3% 68,614 65,234 5.2% 61,047 12.4%
Total liabilities and equity 600,931 561,220 7.1% 540,382 11.2% 591,417 552,497 7.0% 532,562 11.1%
Financial Indicators — Nine Months 2026 (Year to Date)
CONSOLIDATED STANDALONE
Indicator Current Prior Current Prior
PROFITABILITY — 9M 2026 vs 9M 2025 (annualised)
Return on average equity (ROAE) 26.3% 33.0% 26.1% 34.0%
Return on average assets (ROAA) 3.1% 3.2% 3.0% 3.3%
Net interest margin (NIM)³ 7.2% 7.1% 7.2% 7.1%
Cost of risk (ECL / average loans) 1.03% 2.09% 1.04% 2.10%
Cost-to-income⁵ 36.0% 33.7% 35.0% 32.5%
BALANCE SHEET — 30 SEP 2026 vs 31 DEC 2025
Gross loans-to-deposits⁶ 60.7% 63.8% 61.2% 64.3%
CASA / customer deposits 52.7% 51.4% 52.8% 51.6%
NPLs-to-gross loans 3.70% 3.70% 3.65% 3.64%
Adjusted NPL ratio⁷ — — 2.49% 2.40%
NPL coverage 173.1% 182.9% 175.1% 185.3%
Loan-loss provisions (EGP bn) 18.4 17.5 18.4 17.4
Tier 1 capital ratio⁷ 18.73% 18.42% — —
Capital adequacy ratio⁷ 22.15% 22.06% — —
Liquidity coverage ratio (LCR)⁷ — — 759.0% 811.7%
Net stable funding ratio (NSFR)⁷ — — 177.3% 168.7%
¹ Net interest income plus net fee and commission income. ² Includes dividend income, net trading income, gains from financial investments and share of results of associates. ³ Net interest margin as reported by management. ⁴ Consolidated net profit and total equity include non-controlling interests. ⁵ Administrative expenses divided by total operating income. ⁶ Gross loans to customers and banks divided by customer deposits. ⁷ Capital ratios are reported on a consolidated basis only, and the adjusted NPL ratio, LCR and NSFR on a standalone basis only. Profitability ratios: 9M 2026 vs 9M 2025 (annualised); balance sheet ratios: 30 Sep 2026 vs 31 Dec 2025. NM = not meaningful. Growth rates are calculated on the figures shown; components may not add up to totals due to rounding.
Investor relations and media enquiries: Email: IR.BDC@bdc.com.eg